Tesla (NASDAQ: TSLA) started the week with strong signals for its automotive business. On Friday, October 2, the company said it delivered 486,532 vehicles in the third quarter of 2026, exceeding the 456,896 forecast by Reuters' Visible Alpha by approximately 6.5%. Tesla said it produced 464,391 vehicles in the quarter. TSLA closed Friday at $370.59, up 4.65% from Thursday. The delivery report and positive market sentiment ahead of the October 21 release probably contributed to the stock price increase.
There are a few things worth mentioning. The delivery results improve the volume story, but not the profitability story. For the first 9 months of 2026, Tesla has delivered around 1.325 million vehicles, and it seems likely the company will achieve growth in annual deliveries, which was a challenge for the past several years. The real questions are whether the higher volumes contributed to better cash conversion and automotive margins, or if it took deeper incentives, inventory drawdowns and decreased average selling prices.
Q3 Deliveries Beat Expectations
In Q3, Tesla made 464,391 vehicles, and delivered 486,532, with deliveries outpacing production by more than 22,000. Of the deliveries, 478,237 were of the Model 3 and Model Y, with the balance of 8,295 being other vehicles. The company also reported 13.7 GWh of energy-storage deployments for the quarter.
Wall Street was pleasantly surprised by the delivery numbers and relieved of one of their biggest worries. As of the end of Q3, Tesla had delivered roughly 1.325 million vehicles this year, compared to the full year 2025 delivery total of roughly 1.636 million. This means that in Q4, Tesla must only deliver roughly 311,000 to grow this year over last year, after two straight years of declines.
The delivery mix is also of interest. A headline beat can also come from softer underlying demand and/or more aggressive pricing and/or faster inventory clearance, and/or some mix of the above. Earnings to be released on 21st October will shed more light on this.
Europe Is Becoming a Growth Engine Again
Europe has recently been a bright spot for Tesla. A recent report indicates September registrations in France were up 61.9% and 38.4% in Sweden. Spain was up 24.8% and Portugal registered a massive gain of 128.3%. Even smaller markets like Norway and Denmark showed some gains. Through August, Tesla registrations across the EU, UK, and EFTA posted a 43.3% gain, outpacing the overall BEV market gain of 38.8%.
A rebound in Europe is important because it was previously one of the weakest regions for Tesla. The company has had better comps, more positive government policy and better consumer demand for EVs, but the competition has also increased. The choice of product in Europe has greatly improved for more established automakers and Chinese manufacturers, while Tesla largely still relies on the Model 3 and Y for their volume sales.
I would consider stronger signals to be continued European growth with stable pricing. Discounts might also drive a rebound, but a better local mix (improving product demand and the better mix of products offered) would be more persuasive.
China Remains More Mixed
China also continues to give a less clear picture. Per the agency, Tesla’s retail deliveries in China in August totaled 50,047, a year-over-year decline of 12.4%. Tesla’s Shanghai factory is increasingly becoming an export hub. Yet, evidence of rising export volumes from Shanghai may detract from Tesla’s domestic priority to improve competitive positioning in the world’s largest EV market, especially when demand appears to be relatively weak.
Investors are eager to learn more about pricing strategy in different regions during the upcoming call, while September China retail data had not yet been released when this article was written.
Automotive Margins Remain the Central Weakness
Tesla posted Q2 revenues of $28.24 billion, up 26% YoY, with vehicle deliveries of 480,126. Non-GAAP diluted EPS was $0.33, down from $0.40 a year ago. Total GAAP gross margin was 16.8%, and automotive gross margin excluding regulatory credits was 16.3%, down from 19.2% in Q1 but up from 15.0% a year ago.
Regulatory credit revenue for the quarter was $146 million, compared to $439 million in Q2 last year. Consequently, profitability is increasingly on vehicle economics rather than regulatory credits. For Q3, focus on average selling prices, costs to manufacture each vehicle, how the delivery beat impacted factory utilization and margin.
If higher delivery volumes were achieved through a mix of lower-priced models and/or use of incentives, the improvement to EPS may be small compared to the positive impact to the bottom line, and the headline delivery numbers, may suggest.
AI Spending Is Driving Cash Burn
Tesla is transitioning into an AI, robotics, and autonomous driving company. Capital expenditures in Q2 increased to 5.79billion,a142%increaseyearoveryear.Freecashflowwas-1.09 billion, but operating cash flow was $4.70 billion. Capex for the first half of 2026 totaled $8.28 billion, a significant increase from the $3.89 billion totaled in the first half of 2025.
Management has stated the 2026 capital expenditures will exceed $25 billion, funding a range of projects including AI, manufacturing, semiconductors, Optimus, energy storage, and solar, in addition to their ongoing autonomous driving efforts. As a result, Tesla’s capital allocation strategy is broader than AI. The Cash flow Question is, will these various projects produce revenue in a manner that justifies Tesla’s current capital allocation strategy?
Tesla still has $43.52 billion in cash, cash equivalents and short-term investments as of the end of Q2. Negative free cash flow in the quarter demonstrates the investment phase of the company is already impacting shareholder economics.
FSD and Robotaxi Progress Support the AI Narrative
Q2 ended with Tesla reporting 1.48 million FSD subscriptions, a 56% increase YoY. Reuters reported after Q3 deliveries that FSD had received approval in eight European countries, and that Tesla has added Cybercab to its Texas robotaxi fleet. All of these have helped flesh out the AI narrative.
The key element still missing is how it will be monetized. FSD subscriptions can carry much higher margins than hardware sold, and ride in a robotaxi or Autopilot could transform how Tesla generates revenue in the long term. That said, the current valuation already bakes in a large degree of success.
Energy Storage Rises to 13.7 GWh
Tesla reported deploying 13.7 GWh of energy storage in Q3, up from 13.5 GWh in Q2 and about 10% from the year-over-year figure. Demand for Megapacks remains strong to modernize and integrate renewable energy to the grid, as well as increased electricity demands from AI data centers.
Analyst expectations for Q3 were a bit higher, so the upcoming October earnings report should address margins for the segment. I like the long term opportunities as energy storage will provide a more stable business compared to the automotive segment. Continued growth in deployment and profitability will be the best indicator for the business.
October 21 Earnings Are the Next Major Test
Tesla will release its Q3 2026 results after the close on Wednesday, October 21. Management’s Q&A webcast will be at 4:30 p.m. Central Time or 5:30 p.m. Eastern. This report will show if the deliveries during this quarter improved revenues, automotive margin, free cash flow, and if there was positive guidance for Q4.
I am most interested in automotive gross margin, selling prices, operating cash flow, capex, and any commentary for Q4 deliveries. Earnings reports typically answer investors’ most pressing questions; however, in this case, even positive answers will probably not impact the stock price. Keep in mind the focus and expectation around Tesla has shifted to areas outside automotive sales.
Valuation Still Prices in Much More Than Cars
With the October 2, 2026 close of $370.59, the market capitalization is approximately $1.46 trillion. Stock Analysis estimates the forward P/E is approximately 197 and the price to sales is approximately 14. Very little leeway is provided with these estimates if margins continue to be weak or if commercialization of AI takes longer than the market expects.
The Q3 deliveries improved the automotive portion of the business, but it will take more to move the stock price. Improving operating quality and margin will also help build the case for positive free cash flow and clearer monetization from FSD and robotaxis.
Tesla Technical Analysis: TSLA Reclaims $368.84 as Bulls Target $384.59
TSLA bounced nicely off its recent pullback support near $350 and moved back up to close at $370.59 on October 2. What is interesting to me is the move to reclaim the moving average cluster near $363.59 to $364.12, followed by the move to reclaim $368.84, which is the 61.8% retracement level. With those levels reclaimed, the short term bullish structure is again in play, however price is currently testing resistance near $369 to $372. RSI is at approximately 63, with the signal line at approximately 57.
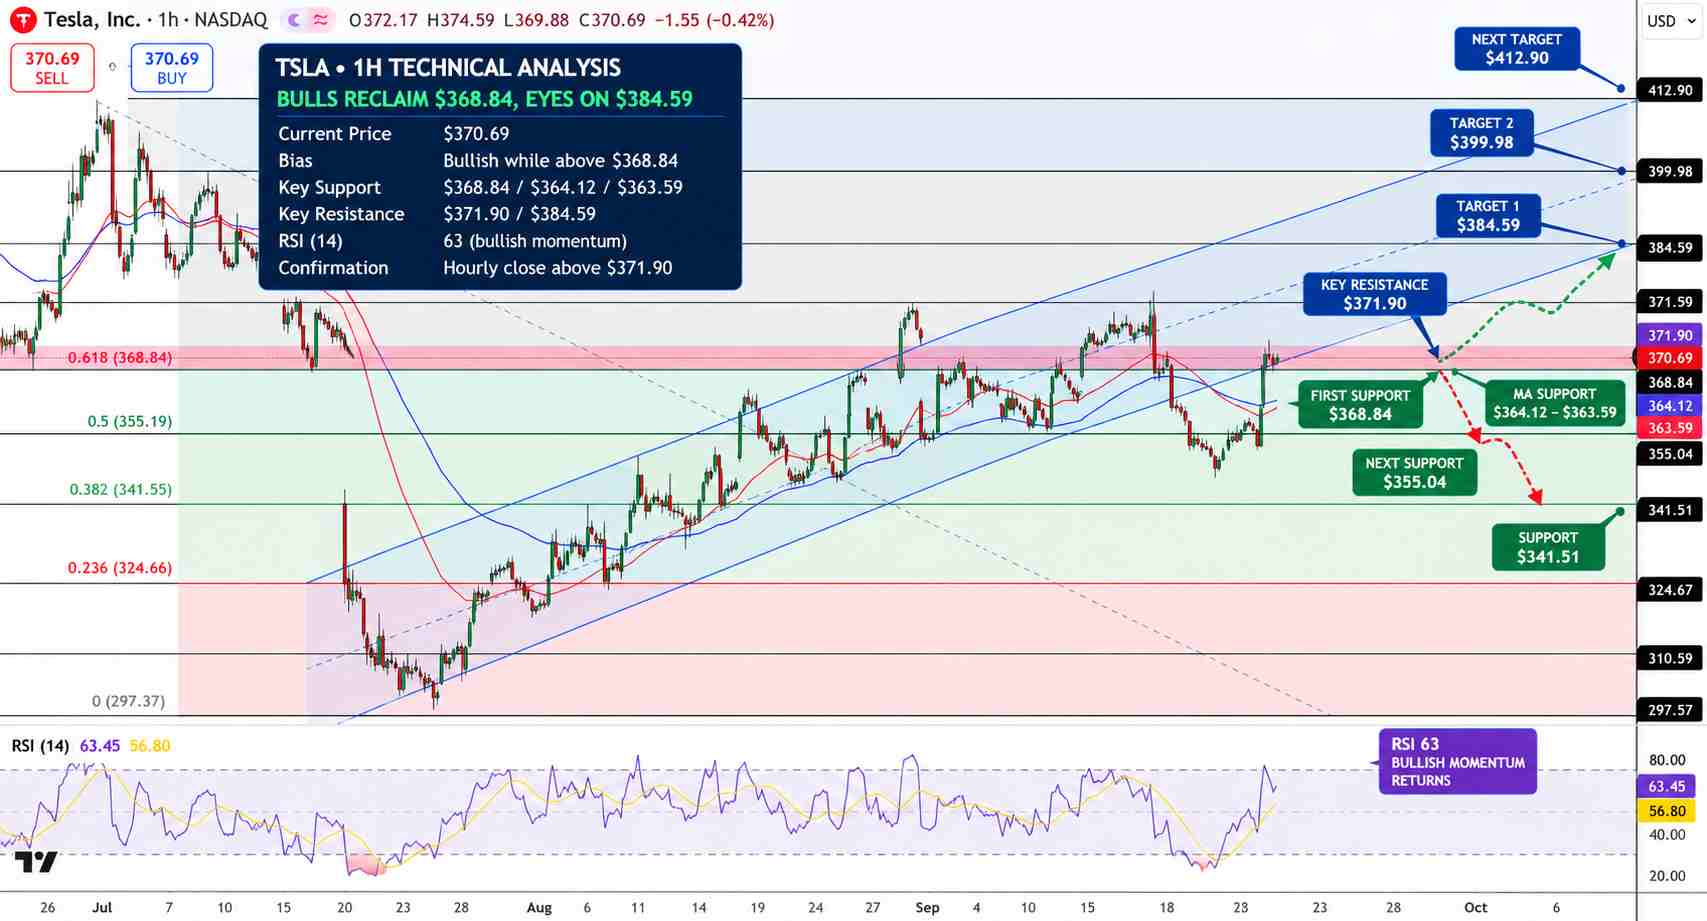
Tesla Stock Price Chart - Source: Tradingview
This leaves a fair amount of space for the bulls to extend the move, before it becomes overbought. The first resistance is at $371.90, with the more major resistance at $384.59. If price continues higher and breaks $371.90, the bulls would then look for additional resistance at $384.59, then $399.98 and $412.90. If price breaks back below $368.84, additional support would then be at the moving average cluster at $363.59 to $364.12, then $355.04 and $341.51. I'm sticking to my bullish bias as long TSLA stays above the $363.59 to $368.84 region.
Key Levels
- Latest Close: $370.59
- Major Support Levels: $368.84, $364.12 to $363.59, then $355.04
- Major Resistance Levels: $371.90, $384.59, then $399.98
- RSI: approximately 63, bullish
- Breakout Target: $384.59 above a confirmed $371.90 break
Why is Tesla stock in focus now?
TSLA is in the spotlight right now as Q3 deliveries came in at 486,532, which blew estimates out of the water, and has the company on the cusp of returning to positive annual delivery growth. Investors have October 21st earnings on their minds, as they want to see better automotive margins, positive free cash flow, and monetization of FSD before determining if the delivery beat positively impacted the bottom line.
What level confirms a stronger TSLA breakout?
A close above $371.90 reinforces the breakout, and $384.59 comes into play. An close above $384.59 would ultimately point toward $399.98. An close below $363.59 greatly negates the breakout.
Bottom Line
Europe is continuing to recover, overall deliveries beat expectations, and annual vehicle growth is once again looking possible. Energy storage increased sequentially, while FSD and robotaxi progress also supported the AI narrative. The quality of the earnings has been a sticking point for some time. Q2 showed that positive deliveries and revenue can occur despite weaker automotive margins and negative free cash flow. The tech picture for TSLA remains bullish above $368.84, but October 21st needs to show positive earnings in order to support the bullish case.
Find out more